Link Reporting: The 2026 Guide to Tracking, Measuring & Presenting Backlink Results

Link reporting is the process of tracking, organizing, and presenting backlink data so that everyone involved in a link building campaign understands what links were earned, what changed in the profile, and what those changes meant for the business. In this guide, you’ll learn exactly what link reporting involves, what every report should contain, how to track links properly, how to present results to clients, and how to automate the whole thing — all illustrated with real Semrush data.
Bad link reporting is one of the most common reasons agencies lose clients. Not because the link building failed, but because nobody could see what the work produced. A campaign that earned 40 quality placements dies quietly if the report shows only a spreadsheet of URLs with no context, no trends, and no connection to revenue. Good link reporting fixes that: it turns raw backlink data into a story a client or stakeholder can understand in five minutes.
This guide is written for two readers. If you run link building for clients, you’ll get a complete reporting system: what to track, what to include, how to present it, and how to automate it. If you buy link building services, you’ll learn exactly what a good report looks like — so you can tell within one monthly report whether your agency is doing real work or hiding behind spreadsheets. Either way, you’ll also see real data: this article’s proof section uses live Semrush figures, not stock examples.
1. What Is Link Reporting?

Link reporting is the systematic collection and presentation of data about a website’s backlinks — the links earned, the links lost, the metrics that describe them, and the business outcomes they correlate with. A link report is the document (or dashboard) that carries this information to whoever needs it: a client, a boss, a team, or your future self.
There are two common flavors of link reporting. The first is campaign reporting: you report on the links your team actively built during a period — outreach wins, guest post placements, link insertions — and tie them to rankings and traffic. The second is profile reporting: you report on the state of the entire backlink profile — total referring domains, new and lost links, toxicity signals, anchor distribution — regardless of who built what.
Most agencies blend both. The campaign half shows what the retainer bought; the profile half shows what the website actually looks like to Google. Together, they answer the three questions every stakeholder asks:
- What did you do? — placements, outreach activity, pipeline
- What changed? — referring domains, rankings, traffic movement
- What did it mean? — leads, revenue, and the ROI story
Link reporting is not the same as rank tracking, and not the same as a general SEO report. It has its own metrics (referring domains, anchor text, link quality), its own tools (backlink indexes, not rank trackers), and its own failure modes — which we’ll get to in Chapter 9.
The two audiences of every link report
Every link report is read by two kinds of people, and it has to work for both. The skimmer — a founder, a CMO, a busy account manager — reads the executive summary and the charts, and decides in two minutes whether the campaign is healthy. The auditor — an in-house SEO, a technical stakeholder — opens the appendix, clicks the live URLs, and checks whether the placements are real. Write the summary for the skimmer and the data tables for the auditor, and one report serves both.
This dual-audience reality is also why link reporting can’t be fully automated. Machines are excellent at collecting URLs and metrics; they’re terrible at deciding which three sentences the skimmer needs to read. The summary is a judgment call, and judgment is the part of reporting that justifies your fee.
Real-World Proof: What Reporting Looks Like at Scale
Semrush is a company whose entire business is SEO reporting — it sells reports for a living. So its own public link profile is a useful stress test of what real link reporting data actually looks like on a large, well-known website. The figures below were captured live from Semrush’s own tool via its Domain Overview for semrush.com (US database, October 2026):
- Authority Score: 88 — labeled “Industry leader”
- Monthly organic traffic: 3.1M (down 3% month over month)
- Referring domains: 191,576
- Backlinks: 36,157,764
- Organic keywords: 437,247 (down 3.3%)
- Traffic share: 46%
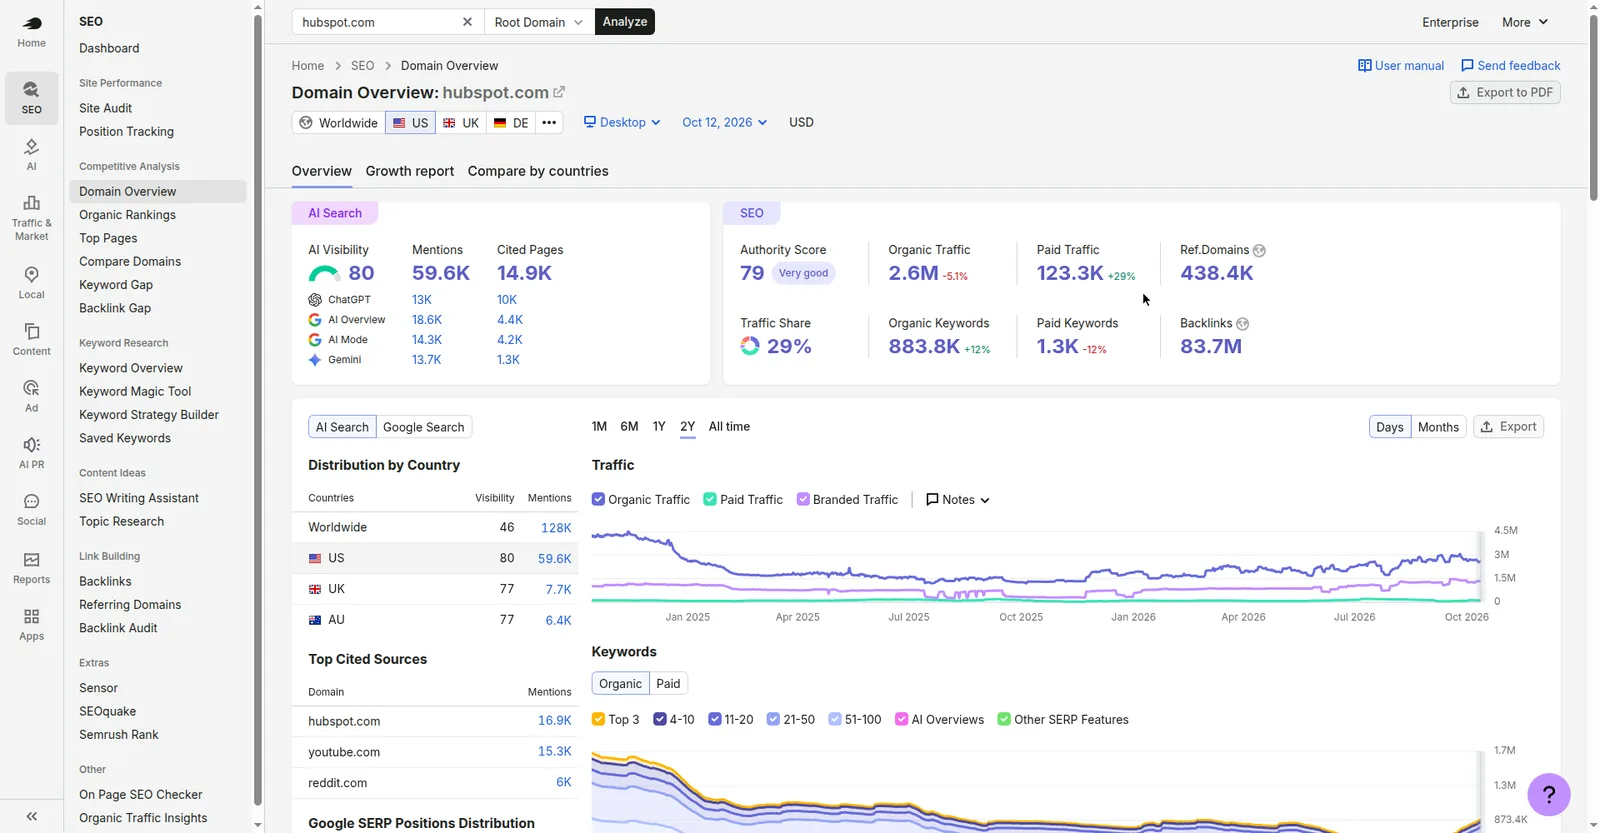
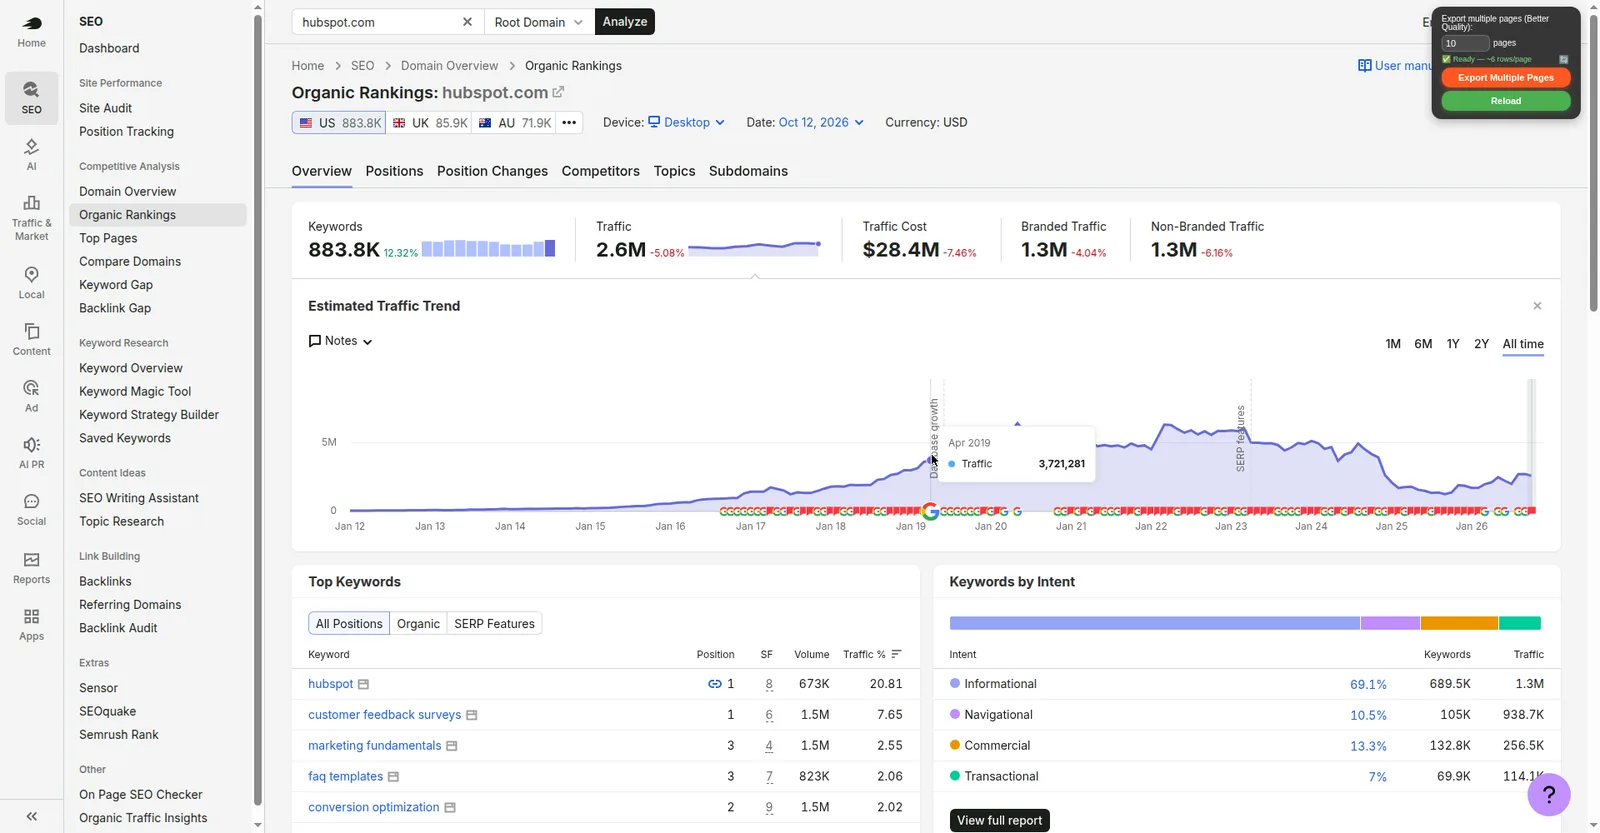
The traffic trend chart tells the more interesting story. Semrush’s organic traffic started near zero in 2014, passed about 108,681 visits around November 2019, and peaked at roughly 5.3M monthly visits around early 2025 — before sliding back to about 3.1M by October 2026, a decline of roughly 40% from the peak.
Meanwhile, the referring-domains chart kept climbing the entire time: from roughly 63 in 2014, to 64,346 in July 2019, to 191,576 by October 2026.
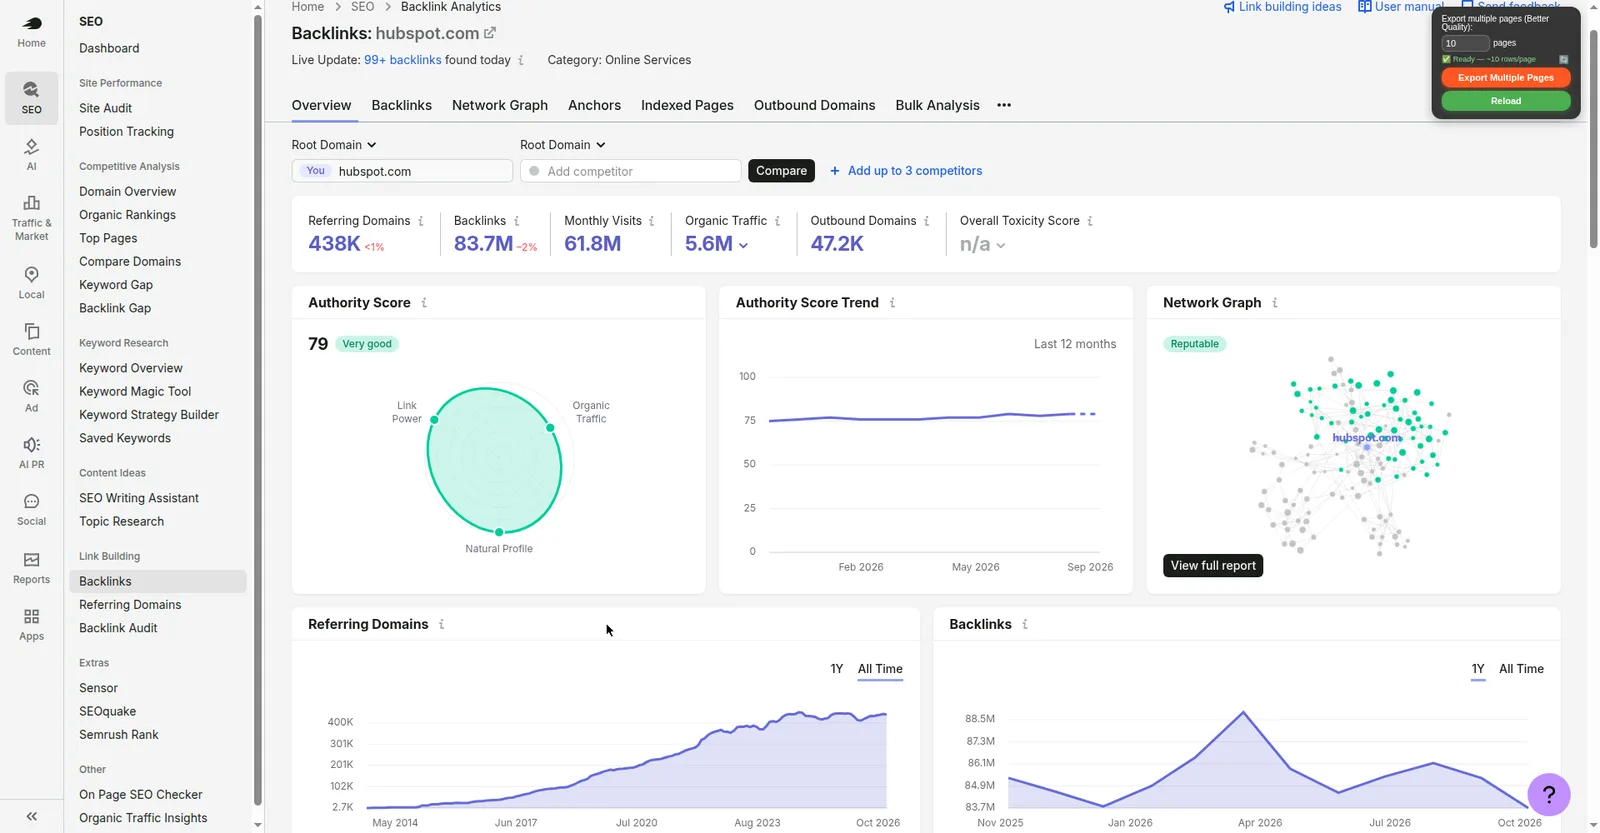
What this proves: link acquisition and organic traffic can move in opposite directions. Referring domains roughly tripled from mid-2019 while organic traffic fell ~40% from its peak. Reporting doesn’t prevent volatility — even the company that sells SEO reports watched its own traffic swing by millions of visits. What reporting does is detect the swing early, explain it honestly, and connect it to the rest of the data. That’s the entire job. (Correlation, not causation: the data shows trends moving together; it doesn’t prove any single cause of the traffic decline.)
2. Why Does Link Reporting Matter?

Link reporting matters because link building is invisible work. When a developer ships a feature, everyone can see it. When a link builder earns a placement on a DR-70 publication, the client sees… a URL they may never click. Without reporting, the client has no idea what they paid for — and clients who can’t see the work don’t renew contracts.
It keeps clients
Client churn is the silent killer of link building agencies. In most cases, churn isn’t caused by bad links — it’s caused by unexplained links. A report that shows 12 new referring domains, which pages they point to, what the anchors were, and how target pages moved in rankings makes the value concrete. One recurring theme in industry surveys: clients stay when they understand what they’re paying for, and clear reporting is often the difference between a one-off project and a year-long retainer.
It justifies the budget
SEO budgets compete with paid ads, content, and development. A paid ads manager can point to a dashboard showing spend versus revenue. Link reporting is how link builders compete for the same budget — by showing placements, ranking movement, organic traffic growth on target pages, and, where possible, attributed revenue. No report means no budget defense.
It drives better decisions
Reporting isn’t just for the client — it’s for you. A good report reveals which tactics actually produce placements (outreach vs. digital PR vs. link insertions), which anchor patterns are building up, which links are being lost, and where the pipeline is thin next month. Agencies that report well improve faster because the data forces honest evaluation of what worked.
It protects you when things go wrong
Traffic drops happen. When they do, the agency with monthly reports showing link velocity, lost links, and ranking trends has a factual basis for diagnosis. The agency with no reports has only excuses. As one reporting best-practice guide puts it: clients respect transparency about drops more than excuses — and reports are where that transparency lives.
It turns link building into a repeatable system
There’s a less obvious benefit: reporting disciplines the link building itself. When you know every placement will appear in a client-facing log with its anchor, its target page, and its quality notes, you build different links. The report becomes a quality filter — nobody wants to present a placement they’re embarrassed to explain. Agencies that report rigorously tend to build better links, not just better reports, because the reporting standard feeds back into the outreach standard.
3. What Should a Link Report Include?

A complete link report answers “what happened, what changed, and what it means” in that order. Here’s what every section should contain, from top to bottom:
The executive summary (non-negotiable)
The first thing in the report — a short plain-language summary of the month. Three to five sentences: the biggest win, the headline numbers, any concern, and what’s next. Busy stakeholders should understand the whole report from this section alone. If someone only reads 30 seconds of your report, this is the 30 seconds.
New placements log
Every link earned this period, as a table with: live URL of the linking page, the target URL on the client site, anchor text, dofollow/nofollow status, date placed, and the linking domain’s authority metric and organic traffic. Live URLs with indexing status are the single most important thing a client can verify — a placement nobody can check is worth nothing in a report.
Referring domains, not just link count
Report new referring domains separately from raw new links. Ten links from one domain is not the same as ten links from ten domains, and experienced clients know it. Track link velocity too — how this month’s acquisition compares to previous months.
Link quality assessment
For each placement (or for the month’s batch), show relevance of the linking site and page, its traffic, and why the link was pursued. This is where you defend quality over quantity — a short note per placement (“industry publication, 45K monthly visits, in-content editorial link”) beats a raw DA column.
Rankings and traffic impact
Show ranking movement for the target keywords the links were aimed at, and organic traffic change on the target pages. This is the bridge between link activity and business outcomes. A timeline chart marking link placement dates against ranking and impression shifts makes the connection visual.
Lost and broken links
Every honest report includes what was lost. Link decay is natural — pages get deleted, links get removed, sites go down. Reporting lost links (and what you’re doing about them, like outreach for reinstatement) builds more trust than a report that only shows wins.
Outreach pipeline
Show what’s in progress, not just what’s finished. A month with five live links and twenty confirmed upcoming placements tells a very different story than five live links and an empty pipeline. Pipeline visibility keeps clients patient during the lag between outreach and publication.
Next steps
Close with what happens next month: targets, tactics, and any decisions you need from the client. A report without next steps reads like a history document; with them, it reads like a strategy.
Anatomy of a one-page link report
Not every stakeholder wants the full document. A one-page version — useful as a cover sheet or a standalone update for executives — contains exactly five blocks: (1) the month’s headline in one sentence, (2) three numbers (new referring domains, target keyword movement, organic traffic change), (3) the three best placements with one-line descriptions, (4) one risk or watch-item, and (5) next month’s focus. If your full report is the evidence, the one-pager is the verdict. Build both from the same data so they never contradict each other.
4. How Do You Track Links for Reporting?

You can’t report what you don’t track. Link tracking for reporting has two halves: placement tracking (links you built — tracked manually from the moment they’re confirmed) and profile tracking (everything pointing at the site — tracked via backlink index tools). The table below shows which metrics matter, what each one tells you, and where the data comes from:
| Metric | What It Tells You | Where to Get It |
|---|---|---|
| New referring domains | Real diversity of link growth — the headline growth number | Ahrefs, Semrush, Moz backlink indexes |
| New backlinks (total) | Volume of link acquisition, including multiple links per domain | Ahrefs, Semrush, Google Search Console |
| Placement log | Exactly which links the campaign earned, when, and where | Manual outreach tracker / CRM spreadsheet |
| Dofollow / nofollow ratio | How much of the new link equity is followed vs. unfollowed | Ahrefs, Semrush link attributes |
| Anchor text distribution | Whether anchors look natural or over-optimized | Ahrefs / Semrush Anchors reports |
| Linking domain traffic & relevance | Whether links come from real, topically relevant sites | Ahrefs / Semrush domain metrics + manual review |
| Lost / broken links | Link decay you need to replace or reclaim | Ahrefs Lost links, Semrush backlink audit alerts |
| Indexing status | Whether new linking pages are actually in Google’s index | Google Search Console, manual checks |
| Target keyword rankings | Whether linked pages are moving in the SERPs | Rank tracker (Ahrefs, Semrush, AccuRanker) |
| Organic traffic to target pages | Whether rankings are converting into visits | Google Search Console, Google Analytics |
| Referral traffic | Direct visitors arriving through the new links | Google Analytics acquisition reports |
| Conversions / revenue | The business outcome everything else points toward | GA4 conversions, CRM attribution |
Two tracking habits separate good reporters from bad ones. First, log placements the day they’re confirmed, not at month’s end — memory is unreliable and URLs change. Second, verify links are still live before reporting them; a placement that disappeared two weeks after publication shouldn’t be reported as a win without a note.
Take a baseline snapshot before the campaign starts
The most underused tracking habit in link reporting is the starting snapshot. Before the first outreach email goes out, record the baseline: total referring domains, referring-domain quality distribution, anchor text mix, target keyword positions, and organic traffic to target pages. Without a baseline, every later report is just numbers floating in space — with one, every report shows change, and change is what clients pay to see. Store the baseline in the same spreadsheet as the placement log so it travels with the campaign.
5. How Do You Build a Monthly Link Report?

A monthly cadence is the industry standard for link reporting: frequent enough to show momentum, spaced enough for meaningful change. Here’s a build process that works for agencies and in-house teams alike:
Step 1 — Pull the data (first week of the month)
Export new and lost backlinks from your backlink tool, pull ranking data for target keywords, and grab organic and referral traffic for target pages. Compare everything against the previous month and the campaign baseline — month-over-month movement is what clients actually read.
Step 2 — Verify the placements
Spot-check the month’s new links: still live? Still dofollow? Linking page indexed? One broken or removed placement caught before the report goes out is worth more than ten unverified rows in a spreadsheet.
Step 3 — Write the executive summary first
Before touching any charts, write the five-sentence story of the month. If you can’t summarize it plainly, the data isn’t ready — go back and find the narrative. Lead with the biggest win, not the biggest number.
Step 4 — Build the sections in order
Summary → placements log → referring-domain growth chart → quality notes → rankings/traffic impact → lost links → pipeline → next steps. This order mirrors how a client reads: “tell me the point, show me the proof, show me the trend, tell me what’s next.”
Step 5 — Keep it short
Aim for three to five pages for most clients: executive summary, key metrics dashboard, and next steps. Busy stakeholders should grasp the highlights in under five minutes. Put the deep data — full placement tables, anchor distributions — in an appendix for the clients who want it, without forcing everyone to read twenty pages.
Step 6 — Send it on schedule, every time
Consistency is part of the product. Whether it’s the 1st or the 5th of the month, send it on the same day every month. And send alert-based updates immediately when something significant happens between reports — a traffic drop, a major ranking change, a lost high-value link. Clients shouldn’t learn about a crisis from their own analytics.
A sample monthly timeline
For a team building its first reporting rhythm, here’s a concrete cadence: days 1–3, pull data and verify placements; day 4, draft the executive summary and charts; day 5, internal review — someone who didn’t build the links reads the report cold and flags anything unclear; day 6, send to the client with a short cover email highlighting the headline; day 7–10, follow-up call or Loom walkthrough for clients who want it. The internal cold-read on day 5 is the step most teams skip and the one that most improves report quality.
6. What Are the Best Link Reporting Tools?

The right stack depends on whether you’re reporting for one site or fifty clients. These are the tools that consistently show up in professional link reporting workflows:
Backlink index tools (the data source)
- Ahrefs — the largest backlink index in most comparisons, with strong new/lost link tracking and anchor reports. The default choice for agencies that report at volume.
- Semrush — backlink analytics plus the domain-overview style reporting shown in this article’s proof section; strong for combining link data with traffic and keyword data in one report.
- Moz — Link Explorer with Domain Authority and spam-score signals; useful when clients already think in “DA” terms.
- Google Search Console — free, and the only source that shows exactly which links Google has actually seen. Limited (sampled, no metrics), but it belongs in every stack as a verification layer.
Reporting and dashboard tools (the presentation layer)
- Looker Studio — free dashboards that pull from Search Console, Analytics, and spreadsheets. The most common way small agencies automate visual link reports without new software costs.
- AgencyAnalytics / DashThis / Whatagraph — dedicated white-label reporting platforms with backlink integrations, scheduled email delivery, and client-facing dashboards. Worth it when you’re reporting for many clients monthly.
- Spreadsheets — don’t underestimate a well-built placement log. For the placements table itself (URLs, anchors, dates, status), a spreadsheet remains the most flexible and verifiable format.
Whatever you choose, the tool matters less than the discipline: one source of truth for placements, one for profile data, and a fixed template so every month’s report is comparable to the last.
How to choose your stack
Pick tools against three criteria. Coverage: does the backlink index actually find your links? Test with ten known placements before committing. Exportability: can you get the data out on a schedule — API, scheduled exports, or at minimum clean CSVs? A tool with great data and no exports is a reporting dead end. Audience fit: a solo consultant needs Looker Studio and a spreadsheet; a 30-client agency needs white-label scheduled delivery. Buy for the reporting volume you have, not the one you hope for — you can upgrade the presentation layer later without losing the underlying data.
7. How Do You Report Links to Clients?

Reporting to clients is a communication skill, not a data skill. The clients who pay for link building are usually not SEOs — they’re founders, marketing managers, or agency account leads. Report for them:
Translate metrics into meaning
Don’t write “acquired 14 referring domains with average DR 52.” Write “earned 14 new linking websites this month, including three industry publications — here’s what each one is and why it matters for your rankings.” Every metric gets one sentence of context: what it is, why it moved, and what you’re doing about it.
Show the pipeline, not just the placements
The hardest months to report are the slow ones. A month with three live links looks like failure — unless the report also shows 25 pitches sent, 8 positive replies, and 6 confirmed placements going live next month. Pipeline reporting turns a thin month into a story about momentum, honestly told.
Be transparent about bad news
Lost links, flat rankings, a placement that got removed — report all of it, with the plan attached. Clients can handle bad news; what they can’t handle is discovering it themselves. Transparency in a down month buys more trust than a great report in an up month.
Connect links to their goals, not your metrics
Your client doesn’t care about Domain Rating. They care about rankings for the keywords that drive revenue, traffic to the pages that convert, and leads. Structure every client report around their goals first, with link metrics as the supporting evidence. The report’s job is to answer “was this worth it?” — not “how many links did we get?”
End with decisions, not just data
Close client reports with what you need from them: content approvals, target page priorities, budget decisions for next quarter. A report that ends with open loops keeps the campaign moving; one that ends with charts just sits in an inbox.
Handle the hard conversations in the report, not around it
Two conversations terrify link builders: “why haven’t rankings moved yet?” and “why did traffic drop?” Both belong inside the report, addressed before the client asks. For the lag question, show the timeline: links take weeks to be discovered and months to influence competitive keywords, and the report’s own placement-date chart demonstrates the work is compounding. For the drop question, bring the diagnosis: which pages fell, what the link data shows (lost links? velocity change? nothing — pointing to an algorithm or content cause), and the remediation plan with a timeline. A report that anticipates the uncomfortable question is the strongest retention tool an agency has.
8. How Do You Measure Link Quality in Reports?

Quantity is easy to report; quality is what actually matters. A report that treats all links as equal is lying by omission. Here’s how to assess and present link quality honestly:
Relevance first
A link from a site in the client’s industry (or a closely adjacent one) is worth more than a higher-authority link from an unrelated site. In your report, note the topical fit of each placement — “home improvement blog linking to our kitchen renovation guide” tells a client more than any authority score.
Real traffic on the linking domain
Check whether the linking site gets actual organic traffic. A DR-60 site with zero traffic is often a link farm wearing a costume; a DR-35 site with 50K monthly visits is a real publication. Include the linking domain’s organic traffic estimate next to its authority metric in the placement log.
Placement context
An in-content editorial link inside a relevant article beats a footer link, an author-bio link, or a link buried in a “partners” page. Note the placement type per link — it explains why two links with similar metrics can have very different value.
Indexing and longevity
A link only counts if Google can see it. Confirm the linking page is indexed, and track whether placements stay live over time. A quality report includes a “still live” check on recent placements — it also catches the quiet link removals that erode campaigns.
What not to lean on
Authority scores (DA, DR, Authority Score) are third-party estimates, not Google metrics. They’re useful for comparison but misleading as headline numbers. Never lead a quality section with an authority score alone — pair every score with relevance and traffic context, or drop it.
A simple quality rubric for your reports
If you want quality assessment to be consistent across months and team members, score each placement on four questions, each rated high/medium/low: relevance (is the linking page topically close to the target page?), audience (does the linking site have real traffic?), placement (in-content editorial vs. bio/footer/directory?), and durability (is the linking page established and likely to persist?). A placement scoring high on all four is a report highlight; one scoring low on three is a placement you should be able to defend — or shouldn’t have pursued. You don’t need to publish the rubric to the client, but reporting from one keeps your quality judgments honest month after month.
9. What Are Common Link Reporting Mistakes?

Most link reports fail in the same handful of ways. Avoid these and your reporting is already better than most agencies’:
Mistake 1: Leading with vanity metrics
Opening a report with total backlink count or a raw Domain Authority number gives a distorted picture. Total profile backlinks include old, unrelated, and low-value links that have nothing to do with the current campaign. Lead with what the campaign did — new referring domains this period — and keep profile totals in context.
Mistake 2: Reporting link counts without domains
“We built 50 links this month” sounds impressive until the client learns 44 came from two domains. Always break link counts down by referring domain. If you wouldn’t be comfortable showing the domain breakdown, the number shouldn’t be the headline.
Mistake 3: No context, just numbers
A table of 30 URLs with DA scores and no explanation is a data dump, not a report. Every section needs the “so what”: why these links were pursued, what changed because of them, and what happens next. Numbers without narrative get ignored.
Mistake 4: Hiding lost links
Some agencies quietly drop removed placements from the next report and hope nobody notices. Clients notice — usually when they audit. Reporting lost links with a reinstatement plan builds trust; hiding them destroys it permanently when discovered.
Mistake 5: Claiming credit for everything
If rankings rose the same month links were built, say the links correlated with the movement — don’t claim they caused it. Algorithm updates, content changes, and seasonality all move rankings too. Honest attribution language (“rankings improved alongside 12 new placements”) keeps you credible when the next update moves things the other way.
Mistake 6: Inconsistent formats
Changing the report template every month makes trend comparison impossible and signals disorganization. Lock the template: same sections, same metrics, same order, every month. The only thing that should change is the data.
Mistake 7: Reporting activity instead of outcomes
“Sent 200 outreach emails” is activity. Clients pay for outcomes — placements, rankings, traffic. Report activity in the pipeline section as context for future placements, never as the achievement itself.
The cost of getting it wrong
These mistakes compound. A report full of vanity metrics trains the client to judge you on vanity metrics — and the month those metrics dip for reasons outside your control, you have no narrative to fall back on. Conversely, every honest report is a deposit in a trust account: the month you need the client’s patience — during a Google update, a slow outreach quarter, a reclaimed-link rebuild — you withdraw from the credibility you’ve been building. Reporting is a long game, and the interest rate on honesty is excellent.
10. How Do You Automate Link Reporting?

Manual reporting doesn’t scale. Once you’re reporting for more than a few clients, automation isn’t a luxury — it’s the only way reports stay consistent and on time. Here’s how to automate without losing quality:
Automate the data pulls, not the narrative
Use tool APIs (Ahrefs, Semrush) and scheduled exports to feed new/lost links, authority metrics, and anchor data into a spreadsheet or dashboard automatically. Use Looker Studio or a white-label platform for the visual layer with scheduled email delivery. But keep the executive summary and the quality notes written by a human — that’s where judgment lives, and it’s the part clients actually read.
Build one template, reuse it everywhere
Create a master report template with locked sections: summary, placements, growth charts, quality notes, lost links, pipeline, next steps. Each month, only the data and the summary change. A fixed template cuts build time dramatically and makes month-to-month comparison automatic.
Set up alerts for what matters
Automation’s real value isn’t the monthly PDF — it’s the early warning system. Configure alerts for: new high-authority links (wins to celebrate), lost links from important domains (decay to fix), sudden spikes in new referring domains (possible spam attack or negative SEO), and significant ranking or traffic drops on target pages. These alerts turn reporting from a monthly ritual into continuous monitoring.
Schedule delivery and stick to it
Most reporting platforms support scheduled sends — set the report to generate and email on the same day each month, then use the time you saved to write a better executive summary. The goal of automation is consistency: the report arrives whether you’re busy or not, and the human time goes into insight, not copy-pasting.
Keep a human review gate
Never let a fully automated report reach a client without a human reading it first. Automated pulls include false positives (spam links you wouldn’t want to claim), miss context (a “lost” link that just moved URLs), and can’t write the narrative. The rule: machines collect, humans interpret.
What to automate first
If you’re automating from scratch, do it in this order: first, the placement log — a shared tracker the outreach team updates as links go live, so month-end isn’t a scramble; second, the new/lost link exports from your backlink tool, scheduled monthly; third, the growth charts (referring domains, rankings, traffic) in a dashboard that updates itself; fourth, scheduled delivery of the report shell; last, and only if the volume justifies it, the narrative assembly. Most teams get 80% of the time savings from the first three steps and should stop automating there — the summary is the highest-value human hour in the whole process.
Key Takeaways
- Link reporting turns backlink data into a story stakeholders understand: what was built, what changed, and what it meant.
- Report referring domains over raw link counts, verify placements are live and indexed, and always include lost links and the outreach pipeline.
- Lead with a plain-language executive summary; keep the full report to three to five pages with the deep data in an appendix.
- Even Semrush — a company that sells SEO reports — saw organic traffic fall ~40% from peak while referring domains tripled. Reporting detects and explains volatility; it doesn’t prevent it.
- Automate data collection and delivery, but keep the narrative human-written and every report behind a human review gate.
Frequently Asked Questions
What is link reporting?
Link reporting is the process of tracking, organizing, and presenting backlink data — links earned, links lost, the metrics describing them, and the business outcomes they correlate with — so clients and stakeholders understand what a link building campaign produced and what changed as a result.
What metrics should a backlink report include?
A strong backlink report includes new referring domains, the placement log (live URLs, anchors, target pages, dates), dofollow/nofollow ratio, anchor text distribution, linking-domain relevance and traffic, lost links, indexing status, target keyword rankings, organic and referral traffic, and — where trackable — conversions or revenue.
How often should you send link reports?
Monthly is the standard cadence: frequent enough to show momentum, spaced enough for meaningful change. Send on the same day each month for consistency, and send immediate alert-based updates when something significant happens between reports, like a traffic drop or a lost high-value link.
How do you prove link building ROI?
Connect campaign cost to business outcomes with the formula: ROI = (Revenue Generated − Link Building Cost) ÷ Link Building Cost × 100. Revenue attribution in SEO is usually estimated rather than exact — use organic conversions valued at the client’s average customer value, compare against the retainer cost, and track over several months rather than judging a campaign immediately.
What’s the difference between link reporting and rank tracking?
Rank tracking monitors keyword positions in search results; link reporting monitors the backlink profile and the links a campaign earned. They’re complementary: link reports show what was built, rank tracking shows whether linked pages moved, and together they tell the full story of a campaign’s impact.
Which tools generate link reports?
Backlink data comes from index tools like Ahrefs, Semrush, Moz, and Google Search Console. The report itself is usually built in Looker Studio dashboards, white-label platforms like AgencyAnalytics or DashThis, or a well-structured spreadsheet — with the executive summary always written by a human.
Explore the Rankestra Link Building Library
- Types of Backlinks: The Complete 2026 Guide
- Backlink Exchange: What It Is, Risks & Safe Alternatives
- Authority Backlinks: How to Earn Links That Move Rankings
- Backlink Benefits: 12 Ways Links Grow Your Business
- Link Acquisition: The 2026 Guide to Earning Quality Links
- Link Bait: Content That Naturally Attracts Backlinks
- Tech PR: Digital PR Strategies for Link Building
- Link Building Tools: The 2026 Toolkit Compared
- Backlink Management: Audit, Monitor & Protect Your Link Profile
- Guest Post Service — Premium Editorial Placements
- Link Insertion Service — Contextual Niche Edits
- Content Placement Service — Done-for-You Link Content
- White Label Link Building — For Agencies
- Website Audit — Free & Paid SEO Audits
- How to Get Earned Media: The 2026 Guide to Coverage, Links & Brand Mentions
- High DA Backlinks: The 2026 Guide to Domain Authority & Link Quality
- How Much Do Backlinks Cost? The 2026 Pricing Guide
- Guest Post Outreach: The 2026 Guide to Pitches That Get Replies
- Niche Edits: The 2026 Guide to Link Insertions That Work
- Blog Submission Sites: The 15 Best Places to List Your Blog in 2026
- Web 2.0 Submission Sites: The 15 Best Platforms in 2026
- Link Outreach: How to Earn Backlinks With Outreach in 2026
- Outsource Link Building: The Honest 2026 Guide
- Backlink Submission: The Honest 2026 Guide
- Link Building Specialist: The Honest 2026 Guide
- SEO Outreach Service: The Honest 2026 Guide
- Blogger Outreach Service: The Honest 2026 Guide
- Forum Submission Sites: The 15 Best Forums in 2026